ThinkWise
0
  • Products
  • Pricing
  • Resources
  • About
  • Contact

Impact of Team Performance - Survey Report


The ThinkWise Impact of Team Performance Survey collected the thoughts of more than 100 senior executives from organizations across America who shared their experience of building high-performing teams and the overall impact teams have on a company’s success.

​We asked leaders about the performance realities of their teams, to define the characteristics of high-performing teams and to provide insights into how their teams are in fact performing. Our team aggregated and analyzed the leadership insights. Here’s a snapshot of what you can expect to see:
​
Trends and Key Findings: The importance of developing high-performing teams is clear to senior executives who seek enduring organizational success. 
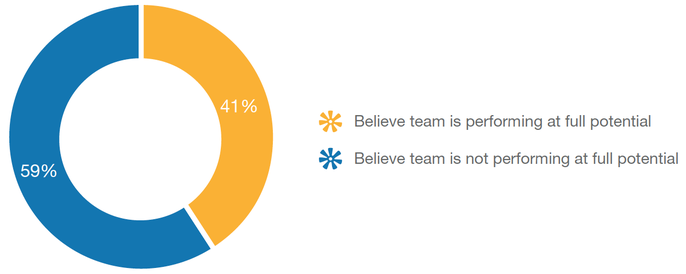
Team Performance Realities: A majority of senior executives (59 percent) believe their internal team is underperforming, and larger teams perform worse.
Traits of a High-performing Team: The trait that high-performing teams utilize most to outperform average teams is effective communication.
Business Case for High-performing Teams: High-performing teams can build affinity, brand appeal and long-term value.
Improving Team Performance: Avoiding accountability is the behavior most likely to be found in underperforming teams.
About the Respondents: A senior business audience that is a cross-section of business owners, C-level executives and VP/director-level team leaders.

Trends & Key Findings
A senior audience of business owners, C-level executives, VP and director-level team leaders contributed insights from their experience of leading teams in a range of small, mid-sized and large organizations (see “About the Respondents”). This collective insight has enabled ThinkWise to determine a number of related trends that clearly demonstrate the impact of team performance on organizational success.

Team size matters
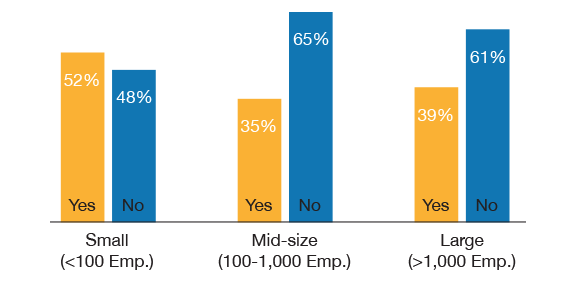
Smaller organizations have teams that perform better than mid-sized and larger organizations. Over half of respondents from smaller organizations (52 percent) rate their team as achievingits potential, compared to 35 percent of senior executives from mid-sized organizations and 39 percent of respondents from large organizations. The least optimistic team leaders work at mid-sized organizations.

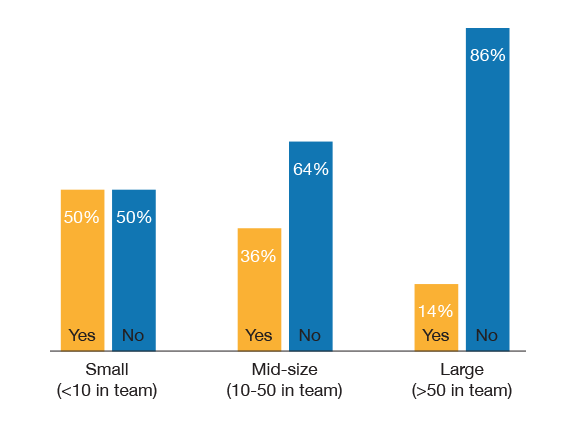
Our findings illustrate that there is also a correlation between the size of the immediate team in which a business leader participates and how effective they believe that team to be. While 50 percent of respondents on a small team (less than 10 people) believe it is underperforming, that jumps to 64 percent when the business leader’s immediate team is 10-50 people. An incredible 86 percent of respondents involved with teams of 50 or more believe those teams are underperforming.
​
A Harvard Business Review article, titled “The New Science of Building Great Teams,” by Alex Pentland, reinforces this point with data from a three-person team, “In a simple three-person team, engagement is a function of the average amount of energy between A and B, A and C, and B and C.If all members of a team have relatively equal and reasonably high energy with all other members,engagement is extremely strong. Teams that have clusters of members who engage in high-energycommunication while other members do not participate don’t perform as well.”

Effective Communication is a Game Changer
The trait that high-performing teams utilize most often to outperform average teams is effective communication. While it’s not a new finding that communication is important, the overwhelming impact that poor communication can have on team performance should be a wake-up call to all.

Leaders of high-performing teams rate communicating frequently (daily or weekly) as the most important (4.24 out of 5) contributor to team success. Smaller teams, again, perform better than their mid-sized and large organization peers due to simpler reporting lines and streamlined communication channels.
​
The Pentland article further supports our findings on the importance of frequency in communication, adding the value of face-to-face exchanges:
​“We now know that 35 percent of the variation in a team’s performance can be accounted for simply by the number of face-to-face exchanges among team members.”
We now know that 35 percent of the variation in a team’s performance can be accounted for simply by the number of face-to-face exchanges among team members.

The Right Performance Management Can Drive Profit (and Other Benefits)
Almost half of underperforming teams (49 percent) recognize they need to pay more attention to the measurement process and secure more measurement data, while three in 10 senior executives admit they need more performance measurement tools.

It is very likely that many organizations are unsure what to measure and instead rely heavily on outdated performance management techniques. Defining team success needs to be in light of corporate strategic goals and tactical (or actionable) outcomes.
​
Bottom line, many organizations do not define what team performance is and therefore do not understand the value it can bring to their business. Performance management techniques need to focus on empowering teams to get the right feedback, at the right time and with the proper support to perform better and positively impact their organization’s goals and objectives.

Planning for Long-term Success
The importance of developing high-performing teams is clear to senior executives who want these groups for the long haul. They believe high performance contributes more to enduring organizational success, such as improving organizational culture, staff retention, profitability and risk mitigation.
Ultimately, while senior executives recognize that team performance plays a critical role in creating and growing organizational value, developing high-performing teams requires time and a disciplined approach to improving performance at both the team and individual levels. Smaller teams appear better suited toward achieving this outcome on a consistent basis.
Team Performance Realities
A majority of senior executives (59 percent) believe their internal team is underperforming. Respondents who identify themselves as “team leaders” are slightly more critical of their team performance (62 percent rate them as underperforming), while respondents who self-identify as “team members” are marginally more optimistic (55 percent rate their team poorly).
​
CHART: 6 in 10 business leaders (59 percent) do not believe their team is achieving its potential
Picture
Team Performing at Full Potential
Smaller organizations have teams that perform better than mid-sized and larger organizations. Over half of respondents from smaller organizations (52 percent) rate their team as achieving its potential, compared to 35 percent of senior executives from mid-sized organizations, and 39 percent of respondents from large organizations. The least optimistic respondents work at mid-sized organizations. Almost two-thirds (65 percent) of senior executives in mid-sized organizations believe their teams are not achieving potential, compared to 61 percent of large company executives.

TABLE: Team performing at full potential: by size of organization (number of employees)
Picture
There is also a correlation between the size of the immediate team a business leader participates in and how effective they believe that team to be. According to Amazon CEO Jeff Bezos, “If a team couldn’t be fed with two pizzas, it was too big.” While 50 percent of respondents on a small team (fewer than 10 people) believe it is underperforming, that jumps to 64 percent when the business leader’s immediate team is 10-50 people, and an incredible 86 percent for teams of 50 or more.
​
TABLE: Team performing at full potential: by size of leader’s team (number of employees)
Picture
Senior executives believe the way a team is built plays a significant role in the team’s ability to perform to its potential. When asked how their teams are currently formed, a majority of business leaders (51 percent) said the role or function determined which people were recruited, while only 11 percent said people were able to self-select, and 41 percent use a combination of methods.

CHART: Only one in 10 senior executives form teams based on inviting employees to self-select
Picture
However, when senior executives were asked which approach generated the best-performing teams, nearly two-thirds (63 percent) identified self-selection. This leads to an obvious question: If self-selecting teams are known by senior executives to create high-performing results, why do only one in 10 (11 percent) currently use this approach? The experience of ThinkWise across a range of industries suggests that many senior executives lack sufficient performance data on available talent to provide top performers with the opportunity to self-select. 
Picture
A large majority (86 percent) of respondents believe they have clearly defined leaders within their teams. This reinforces ThinkWise’s industry experience that confirms appointing leaders based on their previous leadership role or job title contributes less to team performance than how the leader and their previous team performed (using performance metrics). It’s worth noting the creative ways self-selection can lead to corporate innovation and success. Many tech industry hack-a-thons are built on the principle of self-selecting into teams. For example, Atlassian ShipIt Days are legendary for their quick, creative results based on small teams that are passionate about an idea.
Traits of a High-performing Team
The teams identified as high performing are rated better than the average team in most categories of team performance, as would likely be expected. The trait that high-performing teams utilize most to outperform average teams is effective communication (0.4 higher rating) and keeping its commitment to what it says it is going to do (0.28 higher rating).
​
TABLE: What traits do high-performing teams adopt to fulfill their potential?
My team:
Average
High Performing
Difference
Has a strong sense of direction and purpose
3.88
4.03
0.15
Has clear milestones to gauge achievement
3.59
3.74
0.15
Defines what innovation is needed in wider organization
4.45
3.82
-0.63
Defines how the organization can implement innovation
3.19
3.45
0.26
​Works flexibly in order to meet demand
4.26
4.32
0.06
Demonstrates a sense of camaraderie and togetherness
3.85
4.00
0.15
Communicates frequently (daily or weekly)
3.84
4.24
0.40
Keeps commitments; does what it says it's going to do
3.88
4.16
0.28
It is clear that the best-performing teams pay close attention to their objectives, work toward clear milestones with direction and purpose, do what they say they are going to do and communicate what they are doing.
​
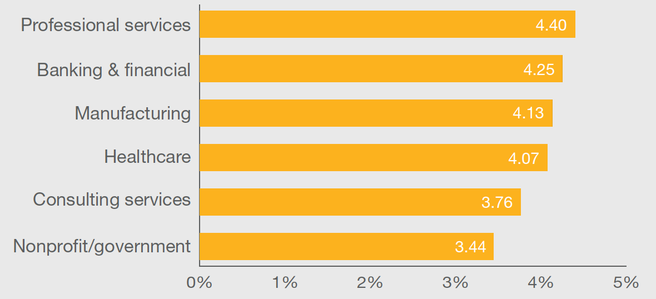
CHART: The most effective communicators, by industry, average rating (out of 5.0)
Picture
The size of a team has a direct impact on the performance traits in which a team excels. Small teams outperform average teams in all but two categories (gauging achievement and defining what innovation is needed in the wider organization). This compares to mid-sized teams (10-50 people) and large teams (50 or more people) that underperform the average in almost every category.
​
TABLE: Performance traits of teams by size, average rating (out of 5.0)
My team:
Average
Small
Mid
Large
Has a strong sense of direction and purpose
3.88
3.96
3.90
3.71
Has clear milestones to gauge achievement
3.59
3.59
3.67
3.14
Defines what innovation is needed in wider organization
4.45
3.55
3.31
3.86
Defines how the organization can implement innovation
3.19
3.23
3.10
3.67
​Works flexibly in order to meet demand
4.26
4.37
4.18
4.00
Demonstrates a sense of camaraderie and togetherness
3.85
3.98
3.71
4.17
Communicates frequently (daily or weekly)
3.84
3.98
3.77
3.67
Keeps commitments; does what it says it's going to do
3.88
3.96
3.82
3.83
Business Case for High-performing Teams
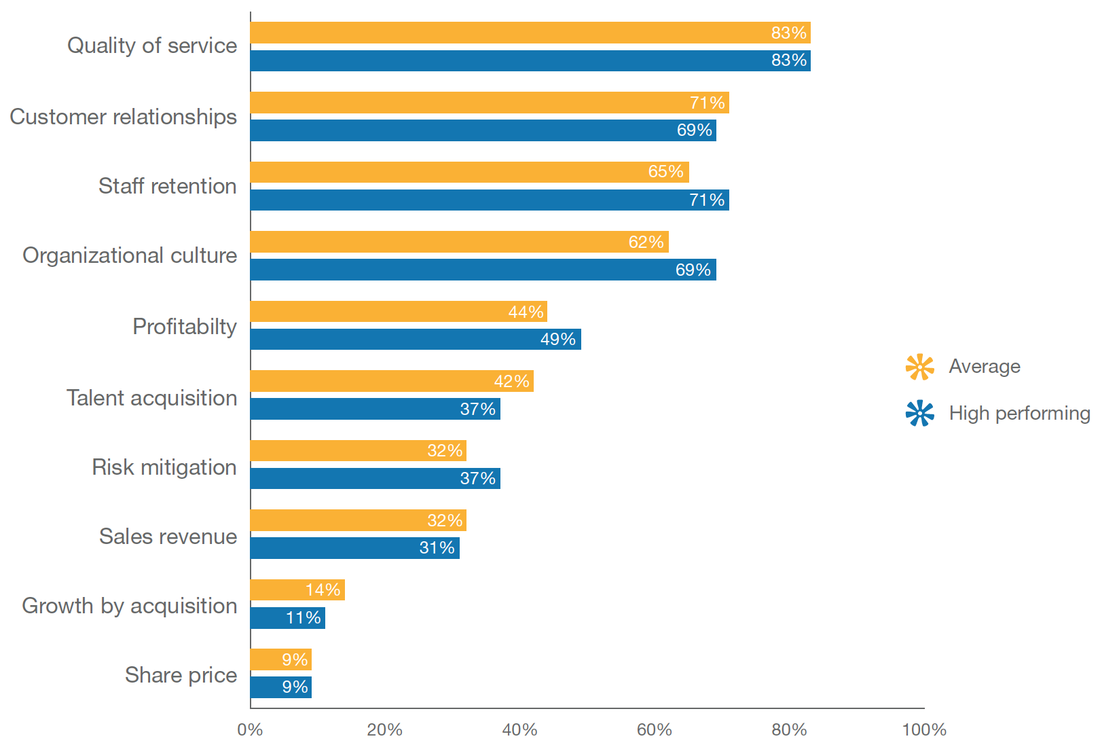
Senior executives believe that a high-performing team can build affinity, brand appeal and long-term value. For example, high-performing teams contribute most to improving organizational culture (seven percentage points higher than average), staff retention (six percentage points higher), and profitability and risk mitigation (both at five percentage points higher). However, they do not believe high-performing teams add to an organization’s ability to recruit talent (five percentage points lower).

CHART: Areas where high-performing and average teams add value to organizations
Picture
As seen frequently within this analysis, smaller teams contribute more to their organizations, due to their higher performance, than mid-sized and larger teams. This finding is in line with the concepts of the Ringelmann effect: as the number of people involved in a group increases, the greater the chance the group will become inefficient, as individuals within the group tend to become less productive.
There are only two categories (customer relationships and staff retention) where senior executives leading small teams believe they perform less effectively than average teams.
​
TABLE: Areas where average, small and mid-sized teams add value to organizations ​
Average
Small
Mid
​Quality of service
83​%
88​%
79​%
​Customer relationships
71​%
68​%
76​%
​Staff retention
65​%
63​%
70%
​Organizational culture
62​%
78%
45​%
​Profitability
44​%
54​%
27​%
​Talent acquisition
41​%
46​%
36​%
​Risk mitigation
32​%
37​%
27​%
​Sales revenue
31​%
44​%
18​%
​Growth by acquisition
14​%
15​%
12​%
Share price
9​%
10​%
9​%
Nearly one in five organizations (18 percent) do not expect to grow revenue in 2015, while a majority (65 percent) expect to grow, and 17 percent are planning for significant growth. Despite evidence suggesting high-performing, small teams are delivering outsized value, it would appear that smaller organizations (100 employees or less) are anticipating more modest growth compared to their mid-sized (100-1,000 employees) peers.
​
TABLE: Modest growth expected for high-performing, small teams compared to mid-sized teams
Average
Small
Mid
Revenue expected to decline
3%
2%
1%
​Revenue expected to be flat
15%
18%
12%
​Modest revenue growth expected
66%
68%
65%
​Significant revenue growth expected
17%
12%
22%
TABLE: High-performing teams not expected to have significant impact on revenue growth
Average
High Performing
​Revenue expected to decline
3%
Revenue expected to be flat
15%
21%
​Modest revenue growth expected
65%
62%
Significant revenue growth expected
17%
17%
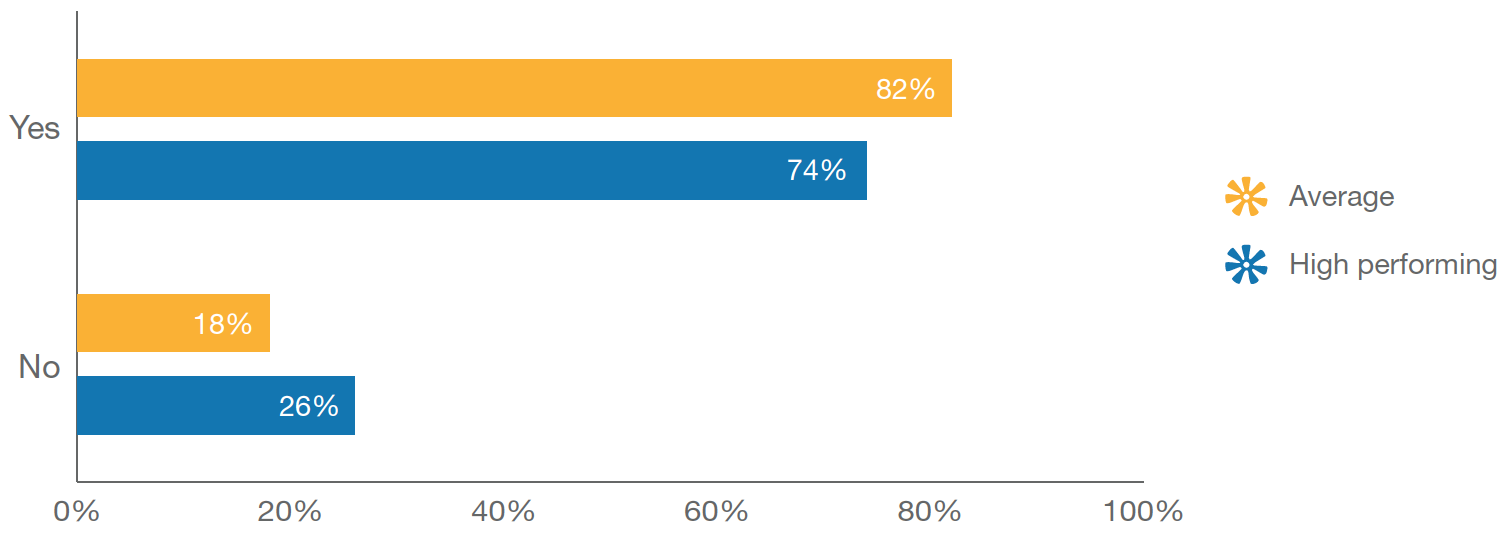
Senior executives with high-performing teams are less likely to believe the performance of their team will have a direct impact on 2015 growth potential; however, a majority will continue to push for high performance. This leads to long-term organizational success, including improved quality of service, staff retention, organizational culture and profitability.
​
CHART: Will team performance have a direct impact on business growth potential
Picture
Improving Team Performance
Avoiding accountability is the behavior most likely to be found in underperforming teams, compared to average teams (10 percentage points higher), while not communicating with a leader when unclear is 9 percentage points higher in underperforming teams. Blaming others for poor performance is also 7 percentage points more likely to exist in underperforming teams.
​
TABLE: Traits most likely to be found in underperforming teams
Average
​Underperforming
Difference
Avoiding accountability
53%
63%
10
​Not communicating with a leader when unclear on a task
54%
63%
9
​Blaming others for poor performance
39%
46%
7
​Feedback about performance is given a low priority by the boss
37%
40%
3
​Complaining about tasks
32%
34%
2
​Spreading rumors about team members
36%
37%
1
​Ignoring assignment deadlines
31%
31%
-
​Being defensive when feedback does occur
46%
46%
-
​Taking credit when it was a team effort
17
14
-3
Therefore, it is perhaps unsurprising to see that senior executives with high-performing teams expect internal team performance to have the greatest impact on organizational value (rated 3.42 out of 5 compared to 3.36 average and 3.3 in underperforming teams).
​
TABLE: Attributes that will impact organizational value, average rating (out of 5.0)
Average
High Performing
Underperforming
​Internal team performance
3.36
3.42
3.30
​Availability of human talent
3.17
3.06
3.25
​Speed of technological change
2.88
2.91
2.86
​Domestic (U.S.) competition
2.75
2.82
2.69
​Availability of financial capital
2.69
2.55
2.84
​Government regulations
2.67
2.64
2.70
​International competition
1.94
2.06
1.83
Senior executives with underperforming teams rate the availability of human talent second highest (3.25), which likely reflects recognition that to improve team performance, talented people must be recruited to their teams.

The impact of technological change (2.91) and domestic competition (2.82) is realized by business leaders with high-performing teams, but overlooked to a greater degree by executives with underperforming teams.

Respondents with underperforming teams also worry more about the availability of financial capital (2.84) and the impact of government regulations (2.7) compared to leaders of high-performing teams. In contrast, business leaders with high-performing teams are looking at international markets (2.06) and domestic competitors (2.82) and preparing their teams to outperform their rivals.

Senior executives with underperforming teams are more likely to ask for performance training to improve team member effectiveness (4 percentage points higher than average and 9 percentage points higher than high-performing teams). They are also more likely to ask for increased budget to improve team performance (4 percentage points higher than average and 8 percentage points more than high-performing teams).
​
TABLE: What is needed to be more successful in improving team performance?
Average
High Performing
Underperforming
​More effective team members from performance training
47%
42%
51%
​More budget
42%
38%
46%
More attention to the measurement process
39%
28%
49%
​More measurement data
29%
21%
37%
More executive-level involvement
24%
28%
20%
More performance measurement tools
23%
17%
29%
More trained HR personnel
19%
24%
14%
​Better alignment of performance with sales
19%
21%
17%
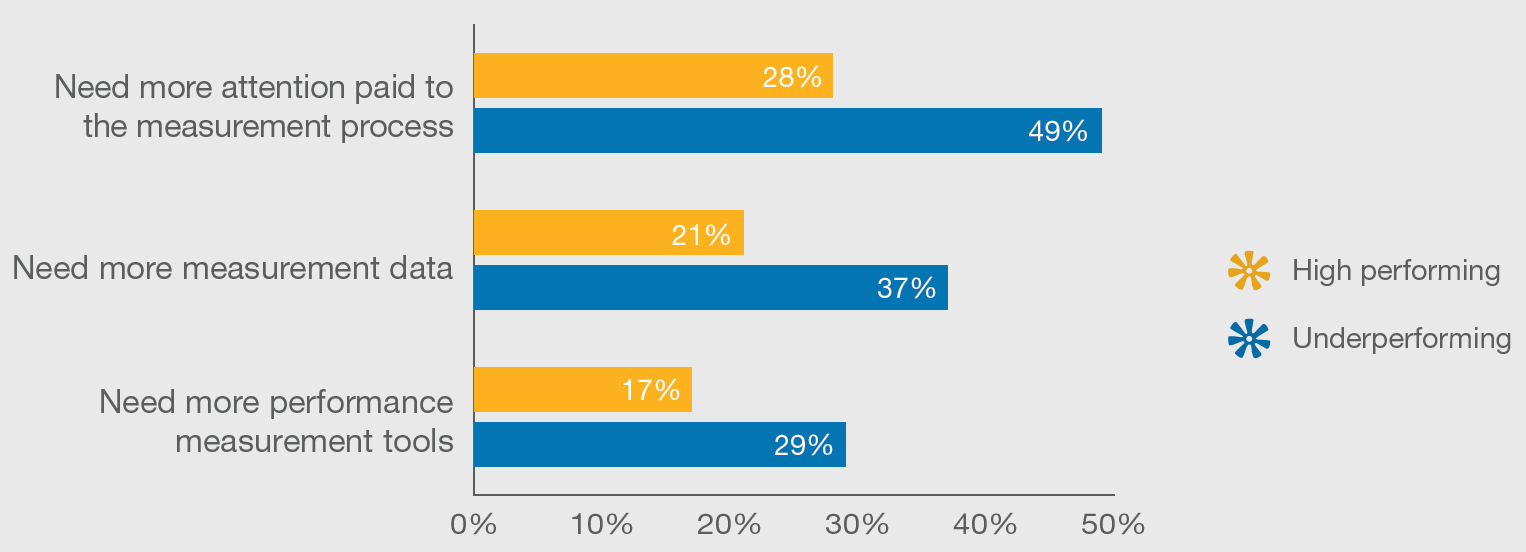
The greatest difference in the ability to improve team performance rests in how they succeed or fail to collect and communicate performance data, as can be seen in the chart below. Almost half (49 percent) of underperforming teams recognize they need to pay more attention to the measurement process, 21 percentage points higher than high-performing peers. Over a third (37 percent) of senior executives with underperforming teams need additional measurement data to be more successful in improving team performance, 16 percentage points higher than peers with high-performing teams. And three in 10 senior executives (29 percent) with underperforming teams seek additional performance measurement tools, 12 percentage points more than peers in high-performing teams.
​
CHART: An inability to measure performance is the greatest impediment to improving performance
Picture
About the Respondents
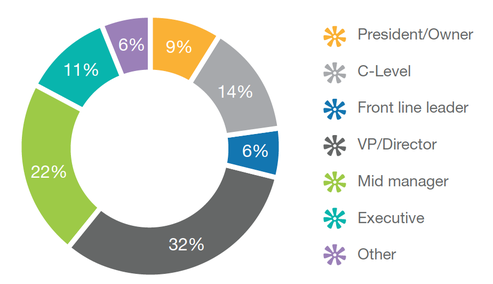
The survey participants represent a senior business audience that is a cross-section of business owners, C-level executives and VP/director-level team leaders.
​
CHART: 55 percent of respondents were senior leaders (business owners, C-level, VP/director)
Picture
As experienced executives, many of the respondents are members of the most senior leadership team in their organization. Possibly as a result of the emphasis placed on teamwork in modern management, a slight majority of respondents consider themselves a “member” of their immediate team (48 percent) rather than a leader of it (43 percent). Just under one in 10 (9 percent) didn’t align to a team.

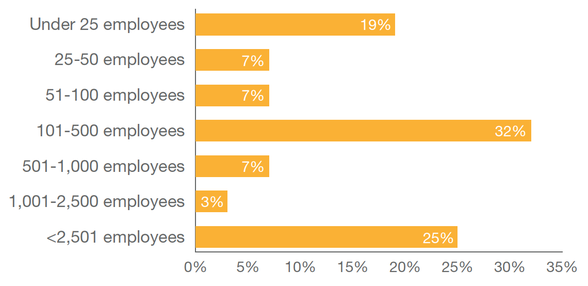
The survey respondents reflect a positive balance of organizational size. Approximately a third (33 percent) are small (less than 100 employees); mid-sized organizations (100-1,000 employees) reflect 39 percent of respondent organizations, while 28 percent of respondents work in large organizations (1,000 or more employees).
​
CHART: Size of respondent’s business by number of employees
Picture
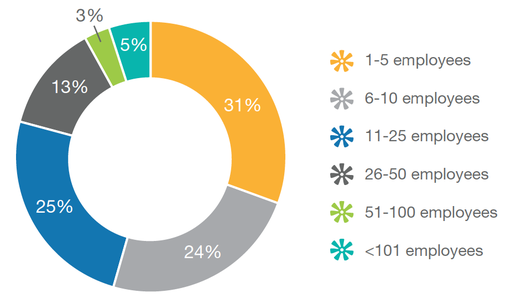
A majority of business leaders (55 percent) lead teams of 10 people or less, another quarter (25 percent) directly lead up to 25 people, and over one in 10 (13 percent) lead teams of up to 50 people. Only a small percentage of respondents lead teams larger than 50 (nine percent), suggesting that even the biggest organizations are successful when they establish a number of smaller, strong teams within their corporate structure.
​
CHART: Most respondents manage relatively small teams (55 percent smaller than 10 people)
Picture
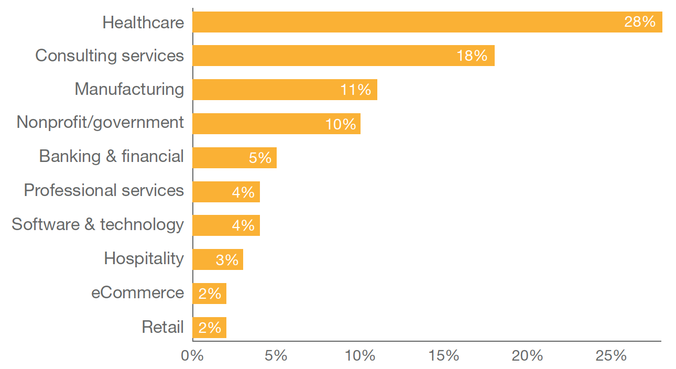
A good range of industries is represented in the survey respondent community. Healthcare dominates with 28 percent, while 18 percent of respondents deliver consulting services, and more than one in 10 (11 percent) work in manufacturing.
​
CHART: Similar team dynamics exhibited across a broad range of industries ​
Picture
Quick Links 
Home
Products

Pricing
Resources
360 Survey
​Team Performance

ThinkBox
About
Subscribe to our mailing list
© 2025 ThinkWise, LLC. All rights reserved.           Privacy       Contact
  • Products
  • Pricing
  • Resources
  • About
  • Contact